Momentum Trading Actually Works... Like, Really, REALLY Well. [Code Included]
The multi-strat guys have been feasting on this for decades — now it's our turn.
Momentum trading — y’know, that strategy you’ve probably heard of but can’t really say exactly how it works?
Well, whether you know how it works or not, it’s a huge business. Pulling from a recent Odd Lots podcast episode: How the Rise of 'Pod Shops' Is Reshaping the Way Markets Trade, a version of momentum trading and statistical arbitrage is at the core of most, if not every multi-strategy hedge fund.
It’s about time that we dive into some medium-frequency strategies, so today, we’ll dive into how this thing actually works, how much it can make, and how we can extract some juice out of it for ourselves.
So, without further ado, let’s get into it.
Momentum Trading Theory
In sum, momentum trading aims to capture a simple market phenomenon: stocks that consistently go up tend to continue to go up in the future and those that consistently go down, continue to go down.
But don’t take my word for it, let’s take a look at AQR Capital’s seminal paper: The Case for Momentum Investing.
The paper defines what momentum is and offers a theory of why the phenomenon occurs:
“Definition. Momentum is the tendency of investments to exhibit persistence in their relative performance. Investments that have performed relatively well, continue to perform relatively well; those that have performed relatively poorly, continue to perform relatively poorly.
…
Intuition. Momentum is a phenomenon driven by investor behavior: slow reaction to new information; asymmetric responses to winning and losing investments; and the "bandwagon” effect.”
Makes sense. But does the data back it up?
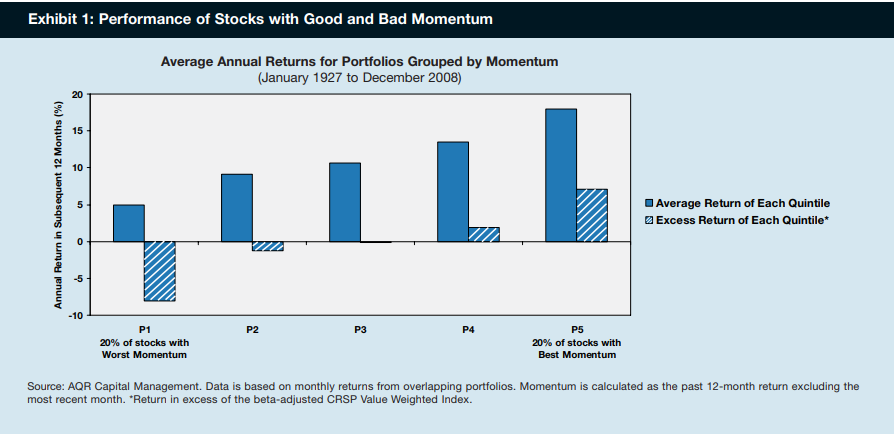
Let’s look at a key figure:
The above image shows that from 1927-2008, stocks which had poor returns in the prior-12 month period continued to post poor future returns in the next 12 months compared to those which had stronger performance in the same prior period.
A sample size of 81 years is about as good as it gets for testing a market phenomenon, so we can safely bet that this is worth looking into. While the sample size increases the chances of this being significant, it’s now a bit old in 2024 and quite a few market participants know about it.
So, let’s see if the phenomenon is still capturable in the present-day. To find this out, we’ll run a simple strategy:
But first, check out these essential papers on the subject:
Fact, Fiction and Momentum Investing (AQR)
Returns to Buying Winners and Selling Losers: Implications for Stock Market Efficiency (Jegadeesh and Titman)
Does it Still Work?
We just want to see if this works, so we will go very crude:
On the first day of every month, calculate the 12-month median return of all stocks
Short the 50 stocks with the lowest median returns and long the 50 stocks with the highest median returns and hold for 1 month.
This will create a market-neutral portfolio that profits if the worst performing stocks continue to perform poorly while the best performing stocks continue to perform strongly.
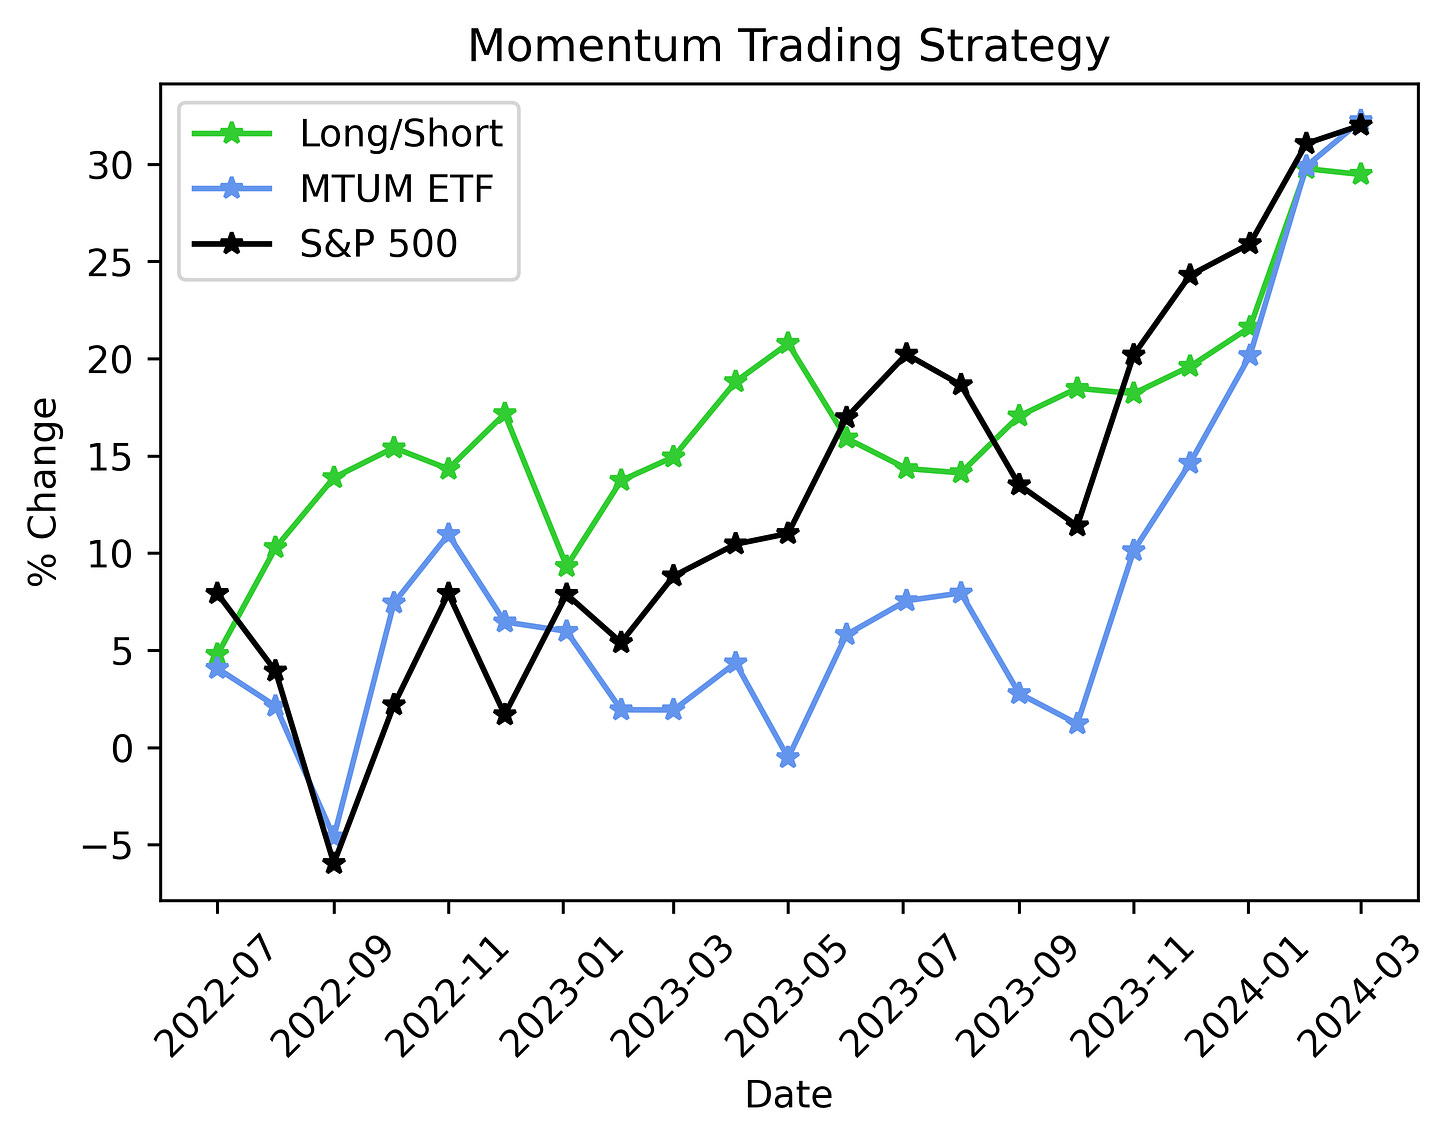
Let’s see how it’s done in recent times:
From July 2022 to early-March 2024, our long/short approach returned ~29%, with the momentum ETF returning ~32%, and the S&P 500 returning ~32% as well.
So, while this crude version didn’t exactly crush the S&P 500, it demonstrated a degree of uncorrelation while still posting comparable returns. In periods where the S&P performed poorly, the strategy performed strongly while still also capturing the upside of when the S&P performed well.
Now, while this is fantastic and confirms that the phenomenon still exists, there are a few things that make trading it a bit restrictive:
Trading this requires quite a bit of capital — well, actually— a **** ton of capital. We ran the experiment with an equal weighted long/short basket of 100 stocks holding ~-$1000/+$1,000 worth of each stock for a grand total of ~$100,000. 100k is petty cash to most multi-strat funds who often have access to leverage exceeding 5x, so you’re unlikely to see this being run consistently with less than $5-10 million.
Transaction costs and execution complexities complicate things at the small scale. Our backtest looks at the gross return without things like short-selling margin fees and bid/ask spreads. While featuring these in likely won’t destroy the strategy, buying hundreds of stocks can get hairy quickly if you aren’t at the scale to call an investment bank’s equities desk and say: “We want to short these 50 names and long these 50 in equal weights by market close, find the shares and get it done by EOD and send us a report of the financing costs.”
But this is The Quant’s Playbook; if there’s money on the table, we sure as heck aren’t just going to watch everyone else eat while we starve.
We need to find a way to effectively replicate the strategy with a lot less money but with the same, if not greater return potential.
Luckily, we’ve got an idea.
Can We Model This Thing?
Now that we know about a market effect, the next step is to model it. With our own custom model, we would be able to refine how we select our long/short basket as we would gain access to things like probability scores, return predictions, and just more flexibility overall.
To see if we can effectively model this, we’ll first do some simple feature engineering to create a few new features from our starting point of historical 12-month returns. I really recommend checking out the free Feature Engineering and Selection: A Practical Approach for Predictive Models as an excellent overview of each step in the model building process.
Features:


