Predicting The Market Might Be Easier Than I Thought
Also, VIX replication, Market-Mechanics Theories, and Potential Edge
After months of playing with data looking for sophisticated, complex edges, I decided to step back and see if there was something a lot more simple, but just as predictive and profitable. Little did I know, it wouldn’t take very long to find it.
Observation 1: The VIX is Actually Kinda Great For Prediction
To start finding predictive relationships, I first looked for products that are dependent on each other. By dependent, I don’t mean correlated, but rather products which are based on other products. There may be no greater example of this than the VIX index and the S&P 500 Index. Because the VIX index is directly derived from the S&P 500 Index, it was a good relationship to act as a jumping off part.
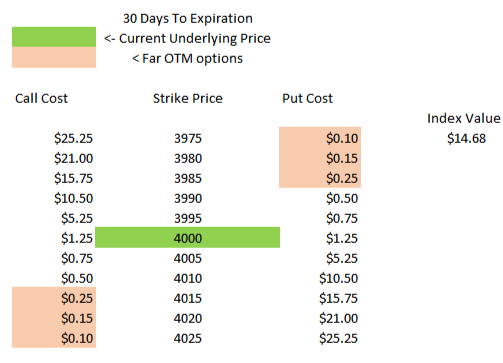
Before going deeper, let’s just do a quick, high-level recap of how the VIX works. In essence, the VIX tracks the weighted-average prices of a strip of options. To see this visually, let’s use the following example:
The VIX acts as a proxy for 30-day volatility, so it’s calculated using options that expire within 23 and 37 days. The prices are weighted to the out-of-the-money strikes, so as the prices of those options increase, so does the VIX.
As shown in the 2 examples above, as the prices of the out-of-the-money options increase, so does the index value. There is a bit more nuance involved in the actual VIX calculation and settlement, but this is the bare-bones of how it works.
So, now that you understand how it works, let’s see how effective of a tool it is:
As demonstrated, when the VIX index increases significantly in 1-month, the S&P 500 is more volatile in the next month.
Now, the why of this relationship becomes less simple. Here are a few theories which may explain this relationship:
Crisis can be sticky. People buy out-of-the-money options to hedge against real-world events and sometimes, those real-world events have longer-lasting effects on prices. For example, in February 2020 as traders bought more OTM options to anticipate a slowdown due to a possible pandemic, the VIX nearly doubled. When the pandemic actually did happen, the next month’s S&P returns were lower and the volatility was higher.
This theory implies that large increases in the VIX can represent a measure of how “serious” a real-world event is. When major news breaks, it is almost immediately priced into SPX options and the VIX rises, so when markets go lower even 30 days after it was priced in by the VIX, one can assume that the event was significant.
Institutions buy out-of-the-money options in anticipation of changing their market position. This is potentially over-simplistic, but it is the most intuitive. Only institutions have the size to make SPX option prices increase/decrease, so we can deduce from this that the VIX is a proxy of institutional activity.
When institutions plan to sell their positions for whatever reasons, they buy puts first to ensure a floor, then the large share positions are liquidated over the course of a month, leading to lower returns in the stock and higher downside volatility.
When they plan to increase their positions, they buy OTM calls to set a ceiling and then positions are accumulated over the course of a month, leading to higher returns and higher upside volatility.
The difficulty of interpreting these results is that the VIX tracks OTM puts and calls, so the VIX may go up from increases in the prices of OTM calls and may not necessarily signal doom.
Okay great, so now that we know that the VIX is a good predictor of volatility, we must ask: is it a good predictor of performance? Here’s the answer:
As demonstrated, there isn’t a very strong correlation between VIX performance and the next month’s returns. From this we can now deduce that predicting price performance is tricky, but predicting volatility may not be that difficult. So what’s next?
Next Steps
Theoretically, if the VIX is a good proxy of the next month’s volatility, can a new VIX that uses 5 to 10 day options be used as a proxy of the next week’s volatility? At this granularity, the signal will likely be noise, but it is definitely worth checking the data for.
Think back to my revision of the VIX where I create a real-time VIX for any individual stock (you can find that here:
If we know that the VIX predicts future S&P 500 volatility, then a VIX for AAPL (or any optionable stock) should predict future n-day volatility for that stock as well. If that’s the case, then just using something as simple as a delta-neutral straddle can get the ball rolling for major returns.
The market is only getting more interesting, there are so many new questions and observations to be made.
It is a good time to be a quant.


