A few weeks ago, we became fascinated with the story of Jamie Mai and Charlie Ledley, commonly known as the two young fund managers from ‘The Big Short’:
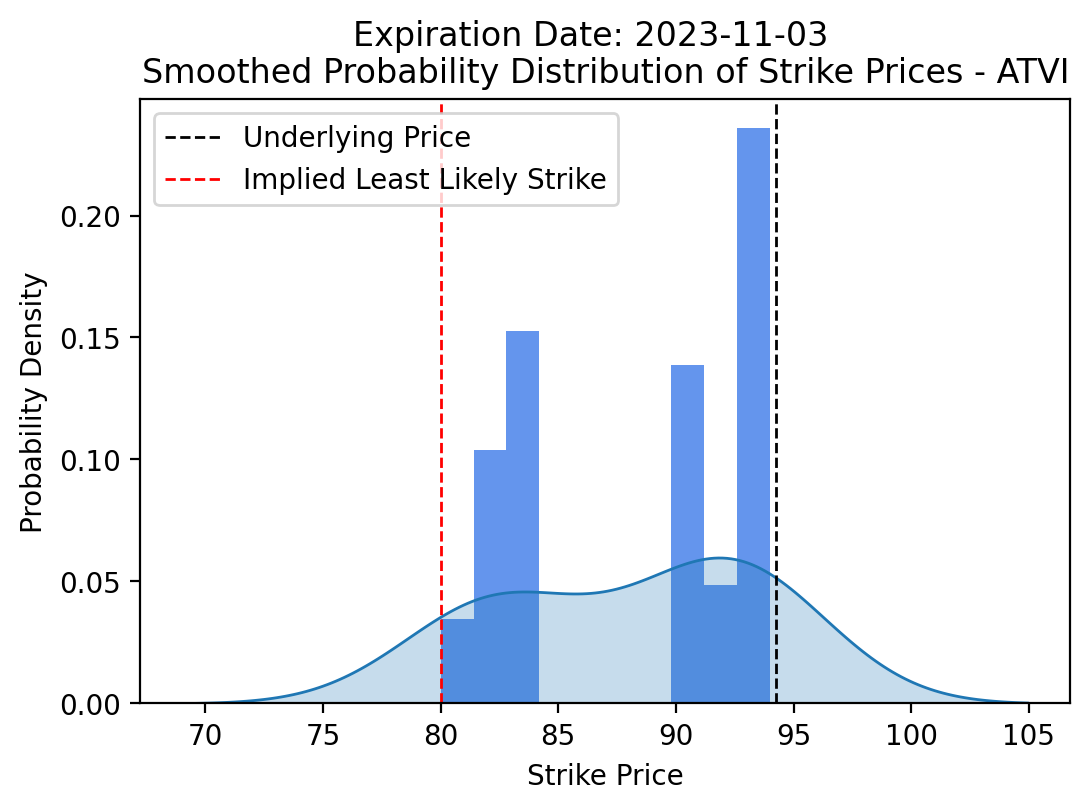
They were brought to the spotlight by their A-AA credit default swap bets back in ‘06 and ’07, but before they were in that deep, they were doing something a bit more interesting. To quickly recap, the two exploited situations where the options market priced in a normal distribution of outcomes, when it should’ve been pricing in a bi-modal distribution.
Take a quick refresher if you’re up to it:
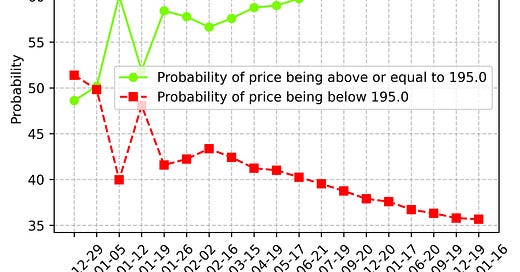
By the end of the experiment, we had developed our own system of modeling implied probabilities based on prices:
But that got us thinking: we settled on using the implied distribution to evaluate a market view, but why not take it a step further? Our thesis was that if, for example, we strongly expected shares of AAPL to be at $210 by the 12/22 expiration, but the options market considered that an extremely low probability (e.g., 210c strike in the tails), then that would mean our trade/thesis had a legitimate edge over the market.
However, more often than not, the options market is pretty smart and tends to accurately price-in available information, sometimes even being a bit more informed than usual. But just how informed is the options market really? If we decide to model an implied probability curve for Boeing’s expiration next Friday and the market estimates a 65% probability of the shares being 5% higher, how often is that true? — and more importantly, can we consistently profit on that information?
To begin, we first need to upgrade our curve building system. As it is now, we use what’s known as a kernel density estimate to get a visual representation of the probability curve:
This is great and allows us to actually see the implied distribution in a very intuitive manner — however, we want to pull out a bit more information. Our ultimate goal is to say with certainty that “the options market is pricing in an x% probability of strike Y being in-the-money by expiration”. So, in order to take this to the next level we’ll need to try a different approach.
A Proprietary Probability Curve
There are dozens of different starting points to choose from when it comes to finding a gauge of probability (e.g., delta, implied vol, volume), but we’ll start simple — price. Price can be interpreted as probability as it may represent the conviction of what investors believe the share price to be at expiration. If investors are paying 2x more for at-the-money puts rather than at-the-money calls before a trial verdict, investors believe that the probability of a downward move is higher than an upward move.
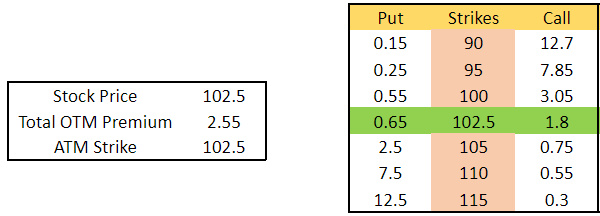
To dive deeper, let’s go visual and start with your garden-variety options chain:
Scenario: We are modeling Stock ABC, and we want to estimate the probability of the stock price being greater than or equal to $105 by the expiration date tomorrow, Friday.


![Replicating Cornwall's $100k to $30m Strategy [Code Included]](https://substackcdn.com/image/fetch/w_140,h_140,c_fill,f_auto,q_auto:good,fl_progressive:steep,g_auto/https%3A%2F%2Fsubstack-post-media.s3.amazonaws.com%2Fpublic%2Fimages%2F5de97886-f572-4034-9bb3-5401f2c5b839_1090x810.png)


