XGBoost? Meet Quantitative Trading.
By applying our betting model infrastructure to trading data, we arrived at a fascinating discovery.
While listening to an obscure podcast on AI safety, a special guest, Nick Patterson, appeared. Mr. Patterson, a former cryptologist, was an integral quantitative researcher in the early days of Renaissance Technologies.
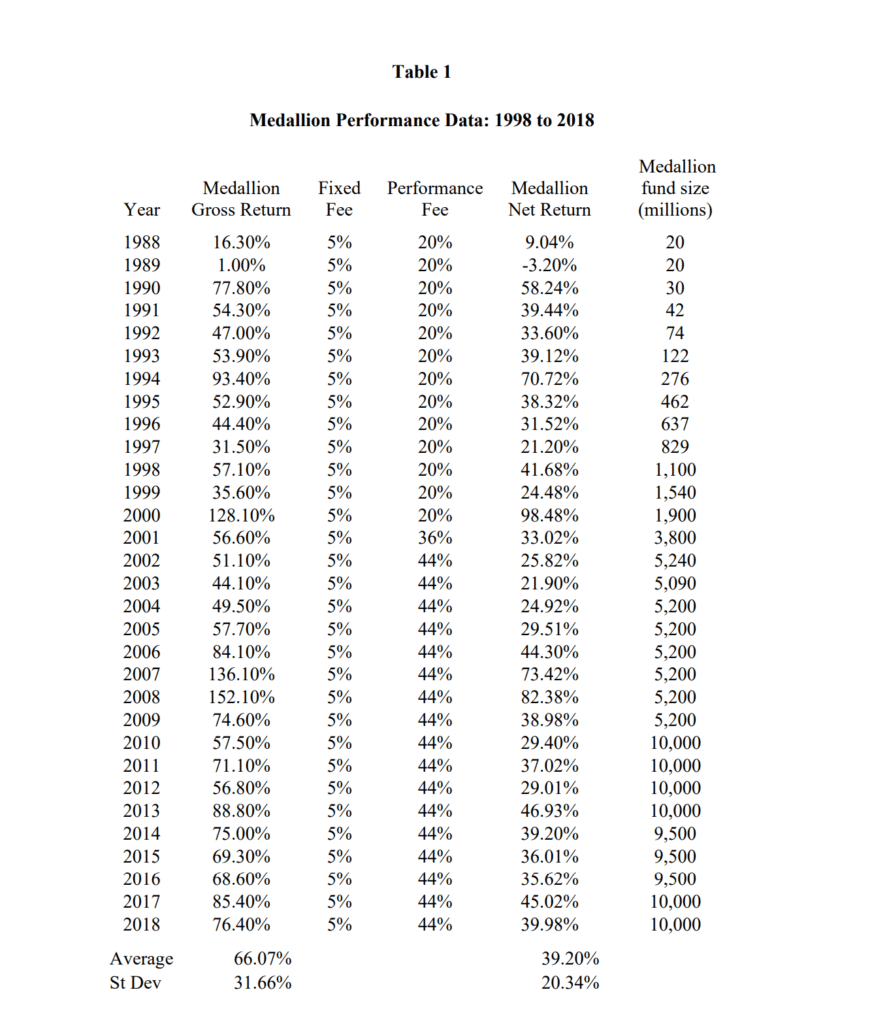
For those unfamiliar, Renaissance’s Medallion Fund, founded by Jim Simons, has led the quantitative hedge fund space, posting double-digit annualized returns since its inception in the 1980s:
The conversation mainly revolved around AI guardrails, but as Mr. Patterson introduced himself, he said something which grasped my attention:
“I joined a hedged fund, Renaissance Technologies, I'll make a comment about that. It's funny that I think the most important thing to do on data analysis is to do the simple things right. So, here's a kind of non-secret about what we did at renaissance: in my opinion, our most important statistical tool was simple regression with one target and one independent variable. It's the simplest statistical model you can imagine. Any reasonably smart high school student could do it. Now we have some of the smartest people around, working in our hedge fund, we have string theorists we recruited from Harvard, and they're doing simple regression. Is this stupid and pointless? Should we be hiring stupider people and paying them less? And the answer is no. And the reason is nobody tells you what the variables you should be regressing [are]. What's the target. Should you do a nonlinear transform before you regress? What's the source? Should you clean your data? Do you notice when your results are obviously rubbish? And so on. And the smarter you are the less likely you are to make a stupid mistake. And that's why I think you often need smart people who appear to be doing something technically very easy, but actually usually not so easy.”
In sum, simple regression with a few inputs was/is responsible for some successes of the fund.
But surely, it can’t be that simple… right? Conventional wisdom says that finding predictive success in markets requires an ostensibly sophisticated, complex, and secretive approach.
However, the words come from a pioneer who’s seen it himself, so it at least warrants a deeper look.
What Do We Predict? And With What?
Fortunately for us, we just recently created a robust pipeline for regression and classification models which allowed us to predict baseball events, so we have the foundation to test this idea out.
However, since this is the absolute start of the experiment, we don’t know which features (inputs) we need and we need to choose a target to make predictions for.
So, we’ll start off with something basic.
Momentum Theory
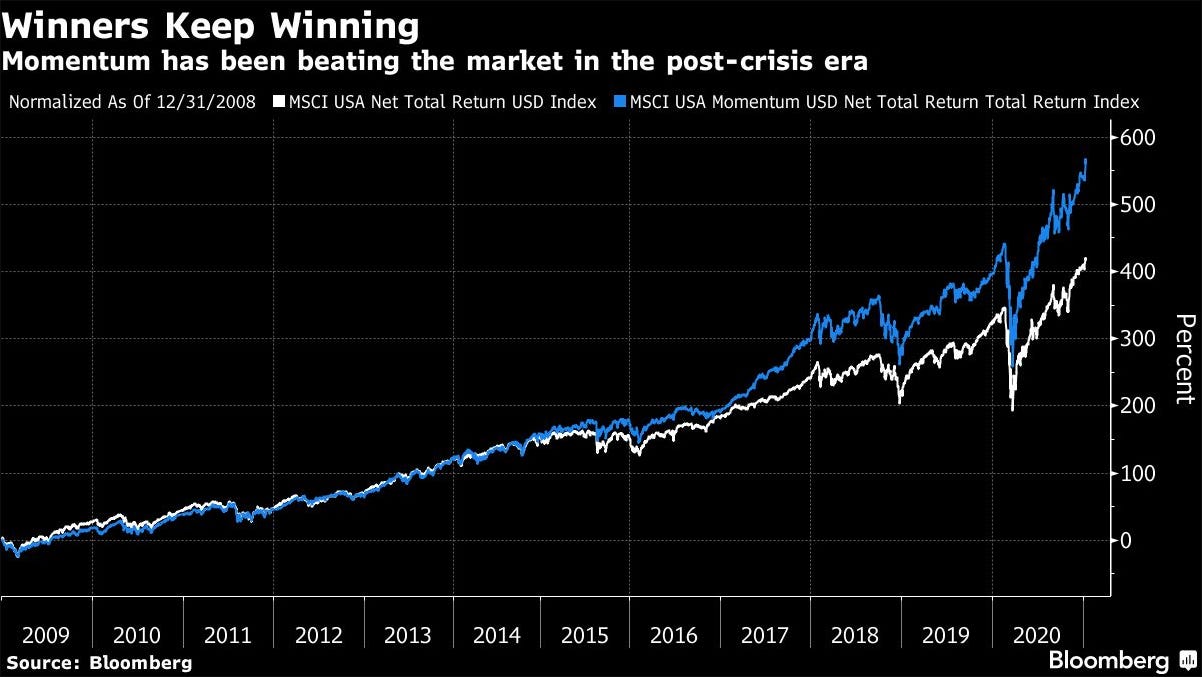
In quantitative trading, momentum refers to a strategy class that aims to capitalize on the continuation of price trends. It is based on the observation that assets that have performed well in the recent past tend to continue performing well, while those that have performed poorly tend to continue underperforming.
So, with this as our baseline, it makes sense for our starting target to be as simple as whether the price of an asset will go up or down. The benchmark for our model accuracy will be >= 51%, since we essentially want to say that: “more often than not, the model accurately determines the closing direction of the stock”. 50% implies that the model is as accurate as a coin-toss, and less than that implies it’s less accurate than a coin toss.
Now, we must decide on the features to be used for predicting this.
Just using the historical data of the stock/asset wouldn’t be enough since it doesn’t contain much information on its own, so we have to be a bit more creative.
Feature Selection
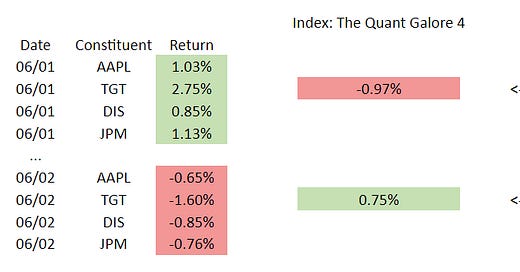
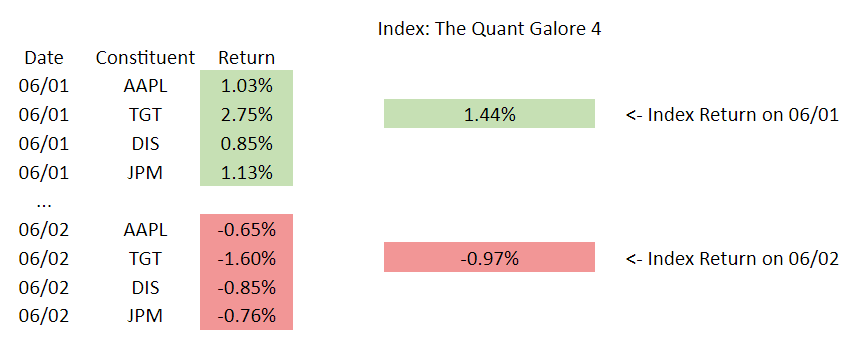
After a few iterations of ideas, we settled on using the returns of index constituents to target the next day’s returns of the index. Here’s a visualizer:
Since we want to predict future values, we need to apply a transformation on the data:
Finally, we don’t want to try predicting what the exact returns will be, we just want to predict a basic up or down. So, we keep the constituent returns as they are, but we transform the index returns to 0s and 1s. If on the next day, the index went down, it is assigned a 0, if on the next it went up, it is assigned a 1.
Here’s what the dataset will look like:
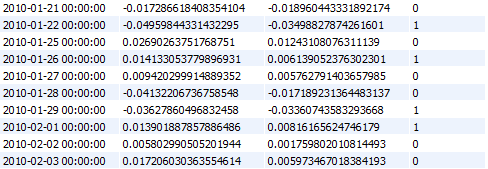
So, now that we have our features and targets, let’s apply it to some real-world data and evaluate some predictions:
Approach: S&P 500 Sector Constituents
The first idea was to see if any relationships can be derived from the performance of the S&P 500 constituents by sector. This approach will help answer questions like: “does strong performance in financials and healthcare translate to higher future returns?”
To start, we will use the SPDR sector ETFs for all of the S&P’s 11 sectors. If we use the stocks with the largest weightings in the S&P, we introduce an overfitting problem since the stock with the highest weight today may not have been the highest weight 6 months ago. Using ETF performance tells us how the sector performed with the dynamically-changing weightings as it really were.
Here’s a look at the new dataset:
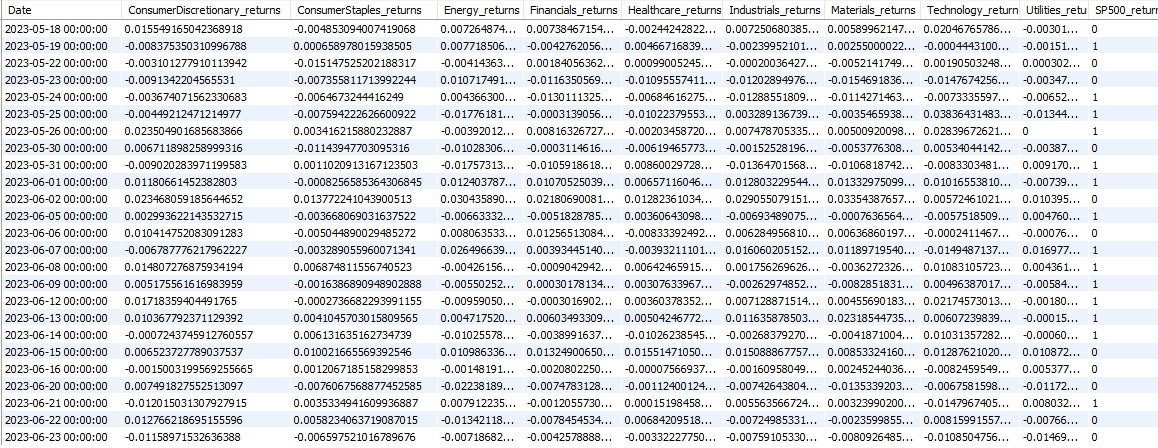
Now, let’s dive into the fun:

